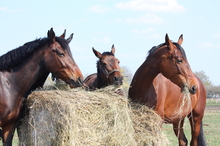
The results of the AHP 2012 Equine Industry Survey show that many horse owners are being impacted by the growing costs of feed, fuel and veterinary services.
To obtain a better understanding of how increased costs have affected horse handlers, survey participants were asked to identify areas in which costs of horsekeeping had increased the most.
In addition, they were asked to indicate potential ways in which they would accommodate any cost increases.

A struggle for horse owners
Horse owners learning to "make do" with increasing costs of feed, fuel, and veterinary services according to 2012 Equine Industry Survey.">
First, respondents were asked to identify up to three areas in which the costs associated with horsekeeping have increased the most. 81.8% of the respondents say that feed of all types, including hay and concentrate, has become more expensive. The increase in feed costs was identified as an issue significantly more often by individuals residing in zip code regions 3, 7, 8, and 9. * See zip code table below
71.4% of the respondents indicate that their fuel costs (which may impact activities such as transportation and pasture maintenance) have increased as well, although the frequency of increased fuel costs are significantly less in zip code regions 0 and 1.
Next, 31.4% of the participants indicated that veterinary services was a source of increased costs, but there was little difference in the change in these costs geographically.
Relative to the 2009-2010 AHP survey, the top 3 sources of increased costs have remained the same; however, significantly more respondents identified both feed and fuel as contributing to increased costs in the current study, whereas significantly fewer identified veterinary care as a factor.
Because costs continue to increase, owners and managers will have to find different ways to cope with these expected increased costs. Most respondents (68.1%) indicate that they will reduce expenditures in other areas of their lives to cope with the increased horsekeeping costs. 32.8% of the respondents indicate that they plan on attending fewer competitions.
Over 25% of the respondents indicate that they will find other sources of income or reduce the number of horses they maintain.
Partial leases are still not very attractive; only 10% indicate that they might pursue cost-sharing measures like half-leases. These responses have changed little since the 2009-2010 study.
*
| Zip Code Region | Zip Codes Included | States Included |
|---|---|---|
| 0 | 00000-09999 | CT,MA,ME,NH,RI,VT. |
| 1 | 10000-19999 | DE,NY,PA. |
| 2 | 20000-29999 | District of Columbia, MD, NC, SC,VA,WV. |
| 3 | 30000-39999 | AL,FL,GA,MS,TN. |
| 4 | 40000-49999 | IN, KY, MI, OH. |
| 5 | 50000-59999 | IA, MN, MT, ND, SD, WI. |
| 6 | 60000-69999 | IL, KS, MO, NE. |
| 7 | 70000-79999 | AR, LA, OK, TX. |
| 8 | 80000-89999 | AZ, CO, ID, NM, NV, UT, WY. |
| 9 | 90000-99999 | AK, CA, HI, OR, WA. |
